
Feature guide
Claude Code usage tracker: tokens, cost per day, quota
How Claude Code usage is measured: the four token fields in each session file, how cost estimates use API prices, what /usage shows, and a daily cost script.
Builds Claude Code and Codex Assist
- Published
- Updated
- Data as of
- Reading time
- 8 min read
TL;DR: Claude Code records usage in every session file. Each response carries four token counts: input, output, cache write and cache read. A usage tracker drops the repeated copies of each response, prices the tokens at Anthropic's published API rates and groups them by day and model. For today's session, run /usage (/cost and /stats open the same screen). For a daily history, run the script below. If you want a dashboard with charts and quota tracking in VS Code, CCAssist builds one from those same files.
What a Claude Code usage tracker actually counts#
Every Claude Code usage tracker, including /usage itself, reads the same data. Claude Code saves each session as a JSONL file (one JSON object per line) under ~/.claude/projects/<project-folder>/. The session files post covers the folder layout and the 30-day cleanup. That cleanup matters here: once a file is deleted, its usage history is gone too.
Each assistant response line has a message.usage object. Here is the shape of one from Claude Code 2.1.286 on 1 October 2026, trimmed to the fields that matter:
{
  "type": "assistant",
  "requestId": "req_…",
  "timestamp": "2026-10-01T…Z",
  "message": {
    "id": "msg_…",
    "model": "claude-opus-5-5",
    "usage": {
      "input_tokens": 2,
      "cache_creation_input_tokens": 26409,
      "cache_read_input_tokens": 26451,
      "output_tokens": 309,
      "output_tokens_details": { "thinking_tokens": 49 },
      "cache_creation": {
        "ephemeral_1h_input_tokens": 26409,
        "ephemeral_5m_input_tokens": 0
      },
      "service_tier": "standard"
    }
  }
}The four token types are priced differently:
input_tokens: new input the model hasn't seen before. In a running session this is often tiny, because almost everything else comes from the cache.cache_creation_input_tokens: input written to the prompt cache (Anthropic's store of recently sent text, which makes resending it cheaper). Thecache_creationobject splits it into 5-minute and 1-hour writes, and the two are priced differently.cache_read_input_tokens: input served from the cache. Claude Code resends the whole conversation on every request, so this number grows with the length of the session.output_tokens: what the model wrote, including thinking. Thethinking_tokensdetail is already part of this number, so don't add it again.
Why adding up every usage line overcounts#
Claude Code writes one line per content block (a thinking block, a text block, each tool call). Every one of those lines carries the full usage object for the response. In the session above, 49 lines had a usage block, but only 19 distinct responses were behind them.
Across all my sessions from the 7 days to 1 October 2026, there were 21,700 usage lines but 10,515 distinct responses. Adding every line would have roughly doubled the total. The fix is to keep one copy per message.id + requestId pair. ccusage and CCAssist both do this.
How token counts turn into a cost estimate#
Multiply each token type by its rate, then add them up. These are Anthropic's published API prices per million tokens (MTok), checked 1 October 2026:
| Model | Input | 5m cache write | 1h cache write | Cache read | Output |
|---|---|---|---|---|---|
| Claude Opus 5.5 | $4 | $5 | $8 | $0.20 | $20 |
| Claude Sonnet 5.5 | $2 | $2.50 | $4 | $0.20 | $10 |
| Claude Haiku 4.5 | $1 | $1.25 | $2 | $0.10 | $5 |
| Claude Fable 5.1 | $10 | $12.50 | $20 | $0.25 | $50 |
Cache writes cost 1.25x the input price for 5 minutes and 2x for 1 hour. Cache reads usually cost 0.1x, but Opus 5.5 reads cost 0.05x and Fable 5.1 reads cost 0.025x. A tracker with one flat cache-read rate gets those two models wrong.
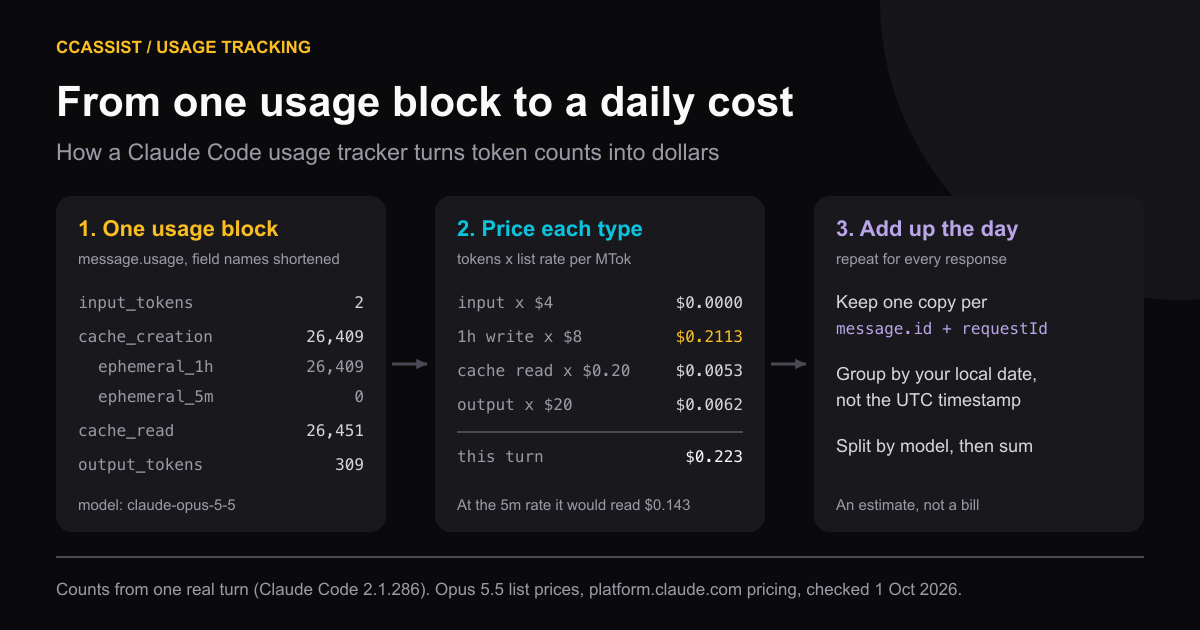
The turn in the diagram comes to about $0.22, and 95% of that is the 1-hour cache write. Priced at the 5-minute rate, the same turn reads $0.14. That gap matters because the Claude Code costs docs say the cache lasts an hour on a subscription, so many of your writes land in the pricier bucket. A tracker that ignores the cache_creation split undercounts.
Token totals and dollar totals also tell different stories. In my own 7 days of data, cache reads were 97.6% of all tokens but 46% of the estimated cost. Output was 0.4% of tokens and 21% of the cost. A token chart shows how much context you resend. The cost chart shows what the expensive work is.
These are estimates at list price. They leave out web search fees ($10 per 1,000 searches, which the session file counts but trackers usually don't price) and any negotiated discount. For API billing, the Console usage page is the source of truth.
Check this session with /usage (and /cost, /stats)#
Current Claude Code has one usage screen. According to the commands reference, /cost is an alias for /usage, and /stats opens it on the Stats tab. It shows:
- Session block: tokens by model and a dollar figure, computed locally at list price. It resets on
/clear(since v2.1.211). - Prompt cache line: the share of input served from cache, and cache misses (v2.1.251 or later).
- Plan usage bars for Pro, Max, Team and Enterprise, plus a breakdown of what used your allowance (skills, subagents, MCP servers). Press
dorwfor the last 24 hours or 7 days.
The docs name its limits: the breakdown only covers "local session history on this machine", and for subscribers the session dollar figure "isn't relevant for billing purposes". It also doesn't keep a history you can scroll back through day by day. That's the gap a tracker fills.
Get Claude Code cost per day with a script#
This Python script reads every session file, drops the repeated copies, prices each response with the table above and prints the last 7 days by local date. It needs Python 3.9+ and nothing else:
import json, glob, os
from collections import defaultdict
from datetime import datetime

# USD per million tokens: input, 5m write, 1h write, cache read, output
# Anthropic list prices, checked 1 Oct 2026
PRICES = {
    "claude-opus-5-5":           (4,  5,     8,  0.20, 20),
    "claude-sonnet-5-5":         (2,  2.50,  4,  0.20, 10),
    "claude-haiku-4-5-20251001": (1,  1.25,  2,  0.10,  5),
    "claude-fable-5-1":          (10, 12.50, 20, 0.25, 50),
}

seen = {}
for path in glob.glob(os.path.expanduser("~/.claude/projects/**/*.jsonl"), recursive=True):
    for line in open(path, errors="ignore"):
        if '"usage"' not in line:
            continue
        try:
            d = json.loads(line)
        except ValueError:
            continue
        m = d.get("message")
        if d.get("type") != "assistant" or not isinstance(m, dict) or not m.get("usage"):
            continue
        key = (m.get("id"), d.get("requestId"))
        seen.setdefault(key, (d["timestamp"], m["model"], m["usage"]))  # first copy wins

days = defaultdict(float)
for ts, model, u in seen.values():
    p = PRICES.get(model)
    if not p:
        continue
    split = u.get("cache_creation") or {}
    w1 = split.get("ephemeral_1h_input_tokens", 0)
    w5 = u.get("cache_creation_input_tokens", 0) - w1
    day = datetime.fromisoformat(ts.replace("Z", "+00:00")).astimezone().date()
    days[day] += (u.get("input_tokens", 0) * p[0] + w5 * p[1] + w1 * p[2]
                  + u.get("cache_read_input_tokens", 0) * p[3]
                  + u.get("output_tokens", 0) * p[4]) / 1e6

for day in sorted(days)[-7:]:
print(day, f"${days[day]:.2f}")Three things to know before you trust the output:
- Models not in
PRICESare skipped. Add a row for every model you use. Rungrep -rhoE '"model":"claude-[^"]+"' ~/.claude/projects | sort | uniq -cto list them. - Subagent sessions are included, because the glob searches every subfolder. Subagents use your allowance too.
- Only this machine is counted. Sessions from a laptop, a remote container or claude.ai aren't in these files.
For a maintained terminal version with JSON output and per-session reports, use ccusage. The ccassist vs ccusage comparison covers when the CLI is the better pick.
Track usage against a Pro or Max subscription#
On a subscription you don't pay per token, so the dollar figure means "what this would have cost on the API". It's useful for comparing days or deciding whether a plan pays off. It doesn't tell you when you'll be cut off.
What limits you is the percentage used in the rolling 5-hour window and the weekly window. Claude Code shows it in /usage and at claude.ai/settings/usage. Those percentages come from Anthropic's servers, not from session files, so a tracker can only show them by asking the same account endpoint. How the windows reset, and how to check what you have left, is covered in Claude Code weekly limits explained.
| Question | Where to look |
|---|---|
| What did this session cost at list price? | /usage (or /cost) |
| What did I use each day this month? | The script above, ccusage or CCAssist |
| How much of my weekly allowance is left? | /usage plan bars, claude.ai settings, or a quota tracker |
| What will my API invoice say? | Console usage page |
| Which session burned my 5-hour window? | /usage breakdown (by skill, subagent, MCP), or CCAssist plan windows |
Where CCAssist fits#
CCAssist (Claude Code and Codex Assist) is a VS Code extension that builds the tracker from your local session files. As of version 0.7.5 (Marketplace, 26 September 2026), running Open Analytics Dashboard from the Command Palette shows:
- Day-by-day table of tokens and cost by local date. You can expand any day into models and reasoning effort, with thinking tokens shown as part of output.
- One view for several CLIs: Claude Code, Codex CLI, Grok CLI and OpenCode, labelled by source. Codex records usage differently (
token_countevents withcached_input_tokens), and the extension reads that format too. See the Codex CLI history viewer for the Codex side. - Model trends, per-project totals and cache hit ratio, with heavy sessions flagged when most of their input missed the cache.
- Quota burn-down: the 5-hour and weekly percentages for Claude (overall, and per model where your plan has a separate limit) and Codex, with a burn rate and a forecast of whether you'll run out before the reset. There's also a status bar indicator and a history of weekly resets.
- Plan windows: pick a past 5-hour or weekly window and see which sessions used it, with each session's share.
Costs use the same method as the script: one copy per response, the 5-minute and 1-hour split, and published API rates. The extension updates its rate table from ccassist.dev and falls back to a built-in table.
Free vs Pro. Free shows the last 7 days in the dashboard. It includes the current and previous plan windows, with session detail for recent days. Pro ($4.99 a month or $49.99 lifetime, see /upgrade/) extends the dashboard to 365 days and unlocks older plan windows and per-session detail for any past day or window.
What it doesn't do. It isn't a bill. It doesn't see usage from other machines or claude.ai. Quota percentages need you signed in to Claude Code or Codex on the same machine, because the extension reads the CLI's saved login to query the account usage endpoint. That endpoint is rate-limited, so the extension checks it every few minutes, not live.
How we checked#
- Session file shape: Claude Code 2.1.286 on macOS, read 1 October 2026. Field names and counts only. No prompt or project content is shown.
- Deduplication figures: every assistant response with a timestamp in the 7 days to 1 October 2026 on the author's machine, keyed on
message.id+requestId. - Token and cost shares: the same responses, priced at the list rates above (Opus 5.5 was 90% of responses).
- Prices: Anthropic pricing page, read 1 October 2026.
/usagebehaviour: costs and commands docs, read 1 October 2026.- CCAssist features and Free/Pro limits: extension source at the 0.7.5 release (Marketplace, published 26 September 2026).
Install CCAssist from the VS Code Marketplace and run Open Analytics Dashboard to see your last 7 days of Claude Code and Codex usage by day, model and project, next to your current quota.
Frequently asked questions
- Where does Claude Code record token usage?
- Every assistant response in a session file under ~/.claude/projects/ carries a message.usage object with input_tokens, cache_creation_input_tokens, cache_read_input_tokens and output_tokens. Cache writes are also split into 5-minute and 1-hour buckets.
- Does /cost still exist in Claude Code?
- Yes, as an alias. In current Claude Code, /cost and /stats both open /usage, which shows the session cost estimate, plan usage bars for subscribers, and a 24-hour or 7-day breakdown.
- Why is my token total so much higher than my bill?
- Most Claude Code tokens are cache reads, which cost a tenth of the input price or less. Trackers that also add up every line in the session file count some responses two or more times, because Claude Code writes one line per content block with the same usage attached.
- Is the cost figure what I pay on a Pro or Max plan?
- No. Subscription plans don't bill per token. The dollar figure is what the same tokens would cost at API list prices. On a subscription, the number that limits you is the percentage of your 5-hour and weekly allowance.
claude-codeusagecostlimitscodex